
improved
Features
UX/UI
Adding Data Labels to Charts
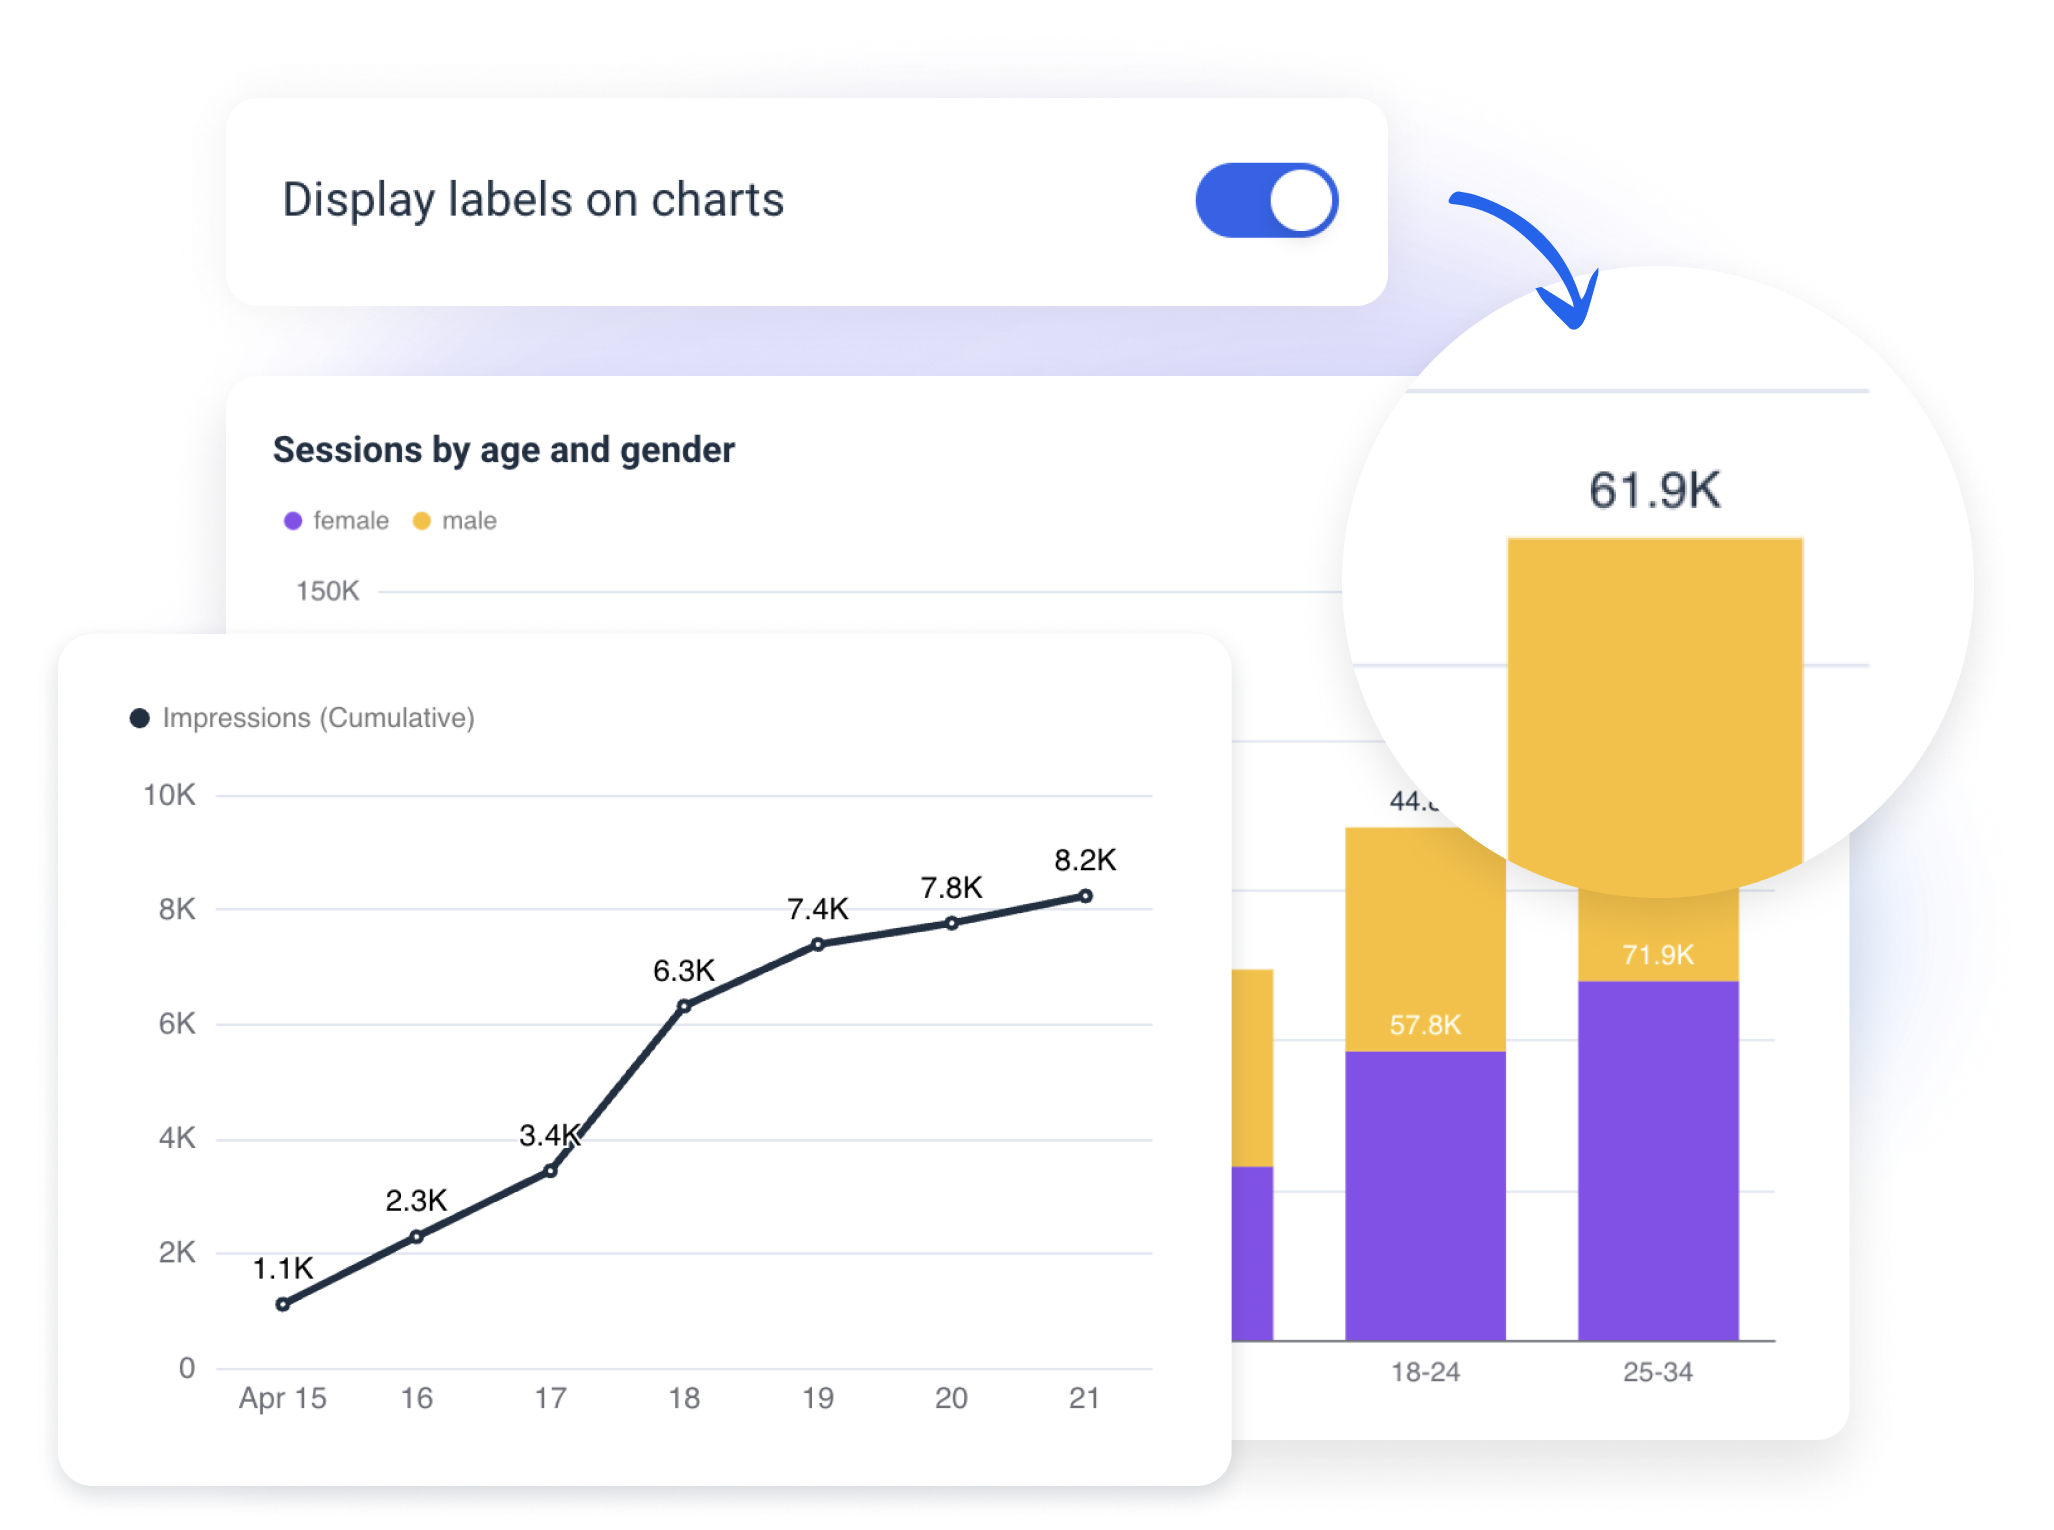
Your reports and dashboards can now include data labels in graphs and charts
. The setting to display data labels has been added to every chart widget. This highly requested update is especially handy to make what you share with clients or stakeholders easier for them to understand, read, and navigate.
How it works:
- Drag and drop any chart-type widget to your report (e.g., line, graph, bar, pie charts).
- Click on the widget to open settings in the sidebar.
- Select a toggle that says "Display labels on charts."
Let us know if you have additional feedback or questions in the Live chat.